By the
numbers

Although the Commission reviews every complaint we receive, we can only accept complaints that meet the requirements outlined in Canadian Human Rights Act.

Throughout the process, Commission staff tailor the services they provide to best meet the needs of those asking for help. Whenever possible, the Commission encourages people to try to resolve their disputes informally and at the earliest opportunity. This often involves mediation.

When warranted, the Commission can refer the case to the Canadian Human Rights Tribunal for a hearing. In some cases, the Commission will participate in the hearing to represent the public interest. The following numbers are related to complaints that were accepted by the Commission in 2018.

The Commission accepted

1,129 complaints

|

This is the highest in a decade.

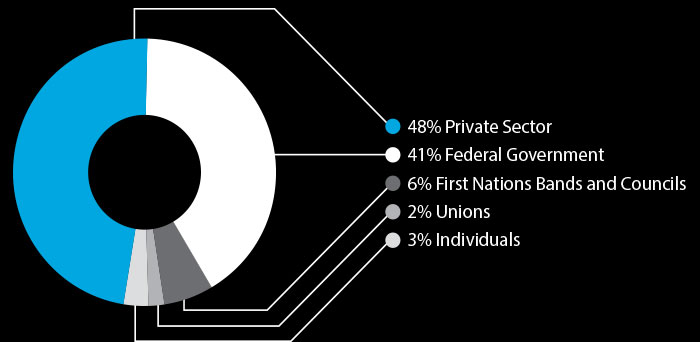
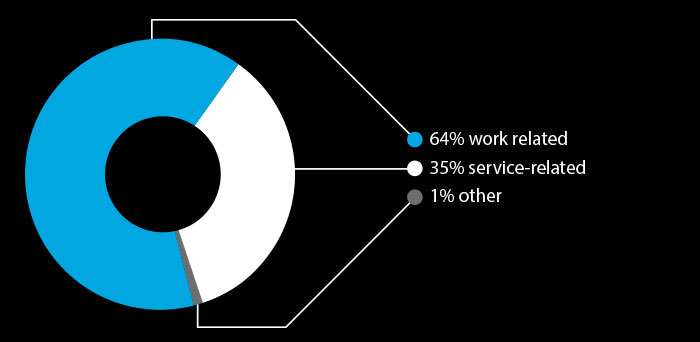
What are the accepted complaints about?

Who are the accepted complaints about?

Proportion of complaints accepted by ground of discrimination

Disability
52%
National or ethnic origin
27%
Race
26%
Sex
18%
Family status
12%
Colour
12%
Age
11%
Religion
9%
Marital status
5%
Sexual orientation
3%
Gender identity or expression
3%
Pardoned conviction
0%
Genetic characteristics
0%

Over half of all disability complaints were related to mental health. This represents 27% of all complaints accepted by the Commission in 2018.


43% of complaints accepted in 2018 cited more than one ground of discrimination

NOTE: In this graph, the total exceeds 100% because some complaints cite more than one ground.

Harassment

Sexual orientation complaints
48% alleged harassment

Sex complaints
45% alleged harassment

Gender identity or
expression complaints

35% alleged harassment

1 in 5
work-related complaints alleged harassment

1 in 20
service-related complaints alleged harassment

The number of complaints citing
disability, national or ethnic origin, race,
colour, religion,
and sex were higher than
in any other year in the past decade.

Disability

UP 33%

National or
Ethnic Origin

UP 98%

Race

UP 118%

Colour

UP 68%

Religion

UP 73%

Sex

UP 41%

Percentages based on number of accepted complaints in 2018 related to each ground compared to the ten-year average.